Groundbreaking poll of Latino undocumented immigrants shows 85% have U.S. citizen family members; and 87% would plan to apply for citizenship if immigration reform passes
A new poll of Latino undocumented immigrants finds they have deep roots in America, with strong family and social connections to U.S. citizens, painting a portrait of a community that is very integrated into the American fabric, and hopeful of a chance to gain legal status and ultimately citizenship. Today, Latino Decisions releases a ground-breaking poll of undocumented Latino residents of the United States, conducted on behalf of the National Association of Latino Elected and Appointed Officials (NALEO) Educational Fund and America’s Voice Education Fund. In the midst of the debate over the future of immigration policy in the United States, the time was right to assess the social and familial ties between undocumented immigrants and American citizens. The poll finds a very strong connection between immigrant communities and other Americans. [PDF of poll results]
The key findings from the poll include:
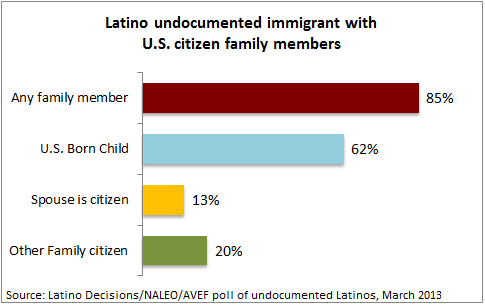
Undocumented Immigrants are closely tied to the American citizens. 85% of undocumented immigrants have a family member who is a U.S. citizen. Among these, 62% have at least one U.S. born child, and 29% have a spouse who is a U.S. citizen or legal permanent resident. Beyond children or spouses, an additional 20% have another family member who is a U.S. citizen, such as a sibling, niece or nephew, aunt or uncle.
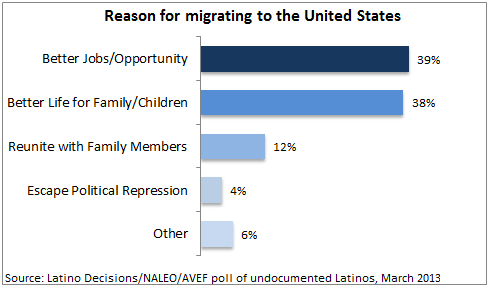
Immigrants come to the United States to work and better their families. Opportunity is identified as the principal reason for coming to the United States. Overall, 77% came to the U.S. for better economic opportunity, or to create a better life for their family. Approximately 39% of our respondents said “better jobs and economic opportunity” as the reason for migration, while another 38% said “to create a better life for [your] family and children.” Another 12% came to reunite with family members.
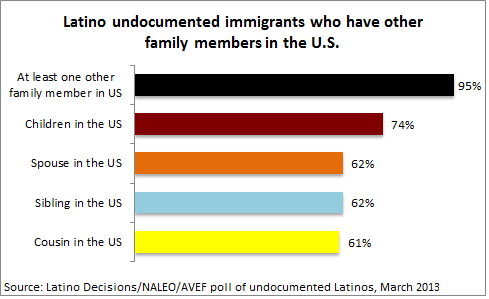
Immigrants are here as families. Whether citizens, legal permanent residents, or something else, a vast majority of undocumented immigrants have other family members also living in the United States. Across all questions about family members, 95% of respondents have at least one other family member in the U.S. About three-quarters (74%) have children living here in the U.S., 62% have a spouse in the U.S., and the same amount, 62% have a brother or sister here, and 61% have a cousin. Undocumented immigrants are overwhelmingly in family environments, not in isolation.
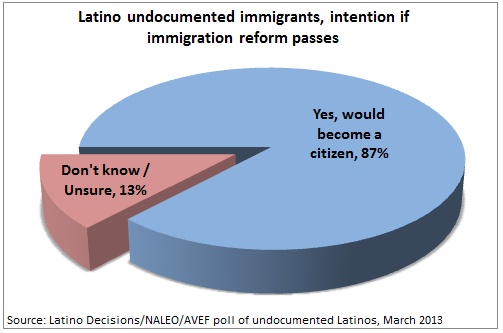
Undocumented immigrants want to be American citizens. When asked what they would do if the law changed to allow a process for them to eventually apply for citizenship, an overwhelming 87% indicated their intention to become a U.S. citizen.
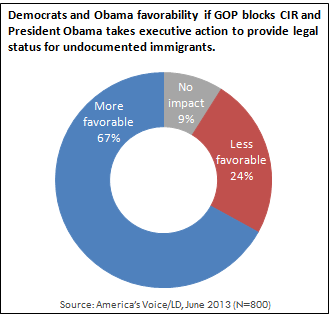
Undocumented immigrants are hopeful that the time for comprehensive immigration reform has come. Over two-thirds describe themselves as more optimistic and hopeful about the chances for CIR compared with other years’ efforts.
Undocumented immigrants are incorporated into the American economy. Large majorities (71%) are in households that own cars, and 15% reported owning their home.
Undocumented immigrants are young, with long work-lives ahead of them. With baby-boomers rapidly aging toward retirement, undocumented persons significantly lower the age of the taxpaying population. The poll finds nearly a quarter of undocumented persons arrived in the U.S. below the age of 18, and 81% of all undocumented respondents arrived at or below 30 years of age.
Undocumented immigrants have deep roots and are not newcomers. Over two-thirds of respondents (68%) have been living in the U.S. more than a decade. By contrast, 22% have been here between 5 and 10 years and only 11% of respondents had been here 5 years or less.
About the poll: Latino Decisions interviewed 400 Latino adult immigrants self-identifying as non-citizens and not “Legal Permanent Residents” or not having any other type of visa or documentation. The poll was conducted between March 4 and March 29, 2013, and all respondents were selected at random in both landline and cell-phone only households. The nominal margin of error is +/- 4.9%. Interviews were conducted in Spanish and English at the subject’s discretion. Additional data points will be released later this week.
For more information: Latino Decisions contacts: [email protected] or gmsegura@latinodecisions; For NALEO Educational Fund contact: Paula Valle, [email protected]; For America’s Voice Education Fund contact: Pili Tobar, [email protected]