In 1998 Harry Pachon and Rudy de la Garza wrote a report for the Tomas Rivera Policy Institute titled “Why Pollsters Missed the Latino Vote – Again!” in which they argued that polls across California failed to accurately account for Latino voters in their samples, and that pre-election polls statewide were fraught with errors as a result. Pachon and de la Garza argued that “mainstream” pollsters failed to account for Latinos for three primary reasons: 1) their sample sizes of Latinos were far too small; 2) their Latinos samples were not representative of the Latino population within the state; and 3) they were not interviewing Latinos in Spanish at the correct proportions. THIS WAS 14 YEARS AGO (yes I am screaming).
In 2010 Gary Segura and I wrote that not much had changed and polls continued to mis-represent the Latino vote. It is now well-known that polls in Nevada had small, unrepresentative and biased samples of Latinos, leading them to entirely miss Harry Reid’s 5-point lead over Sharron Angle. Two weeks ago, Nate Silver wrote at 538 that some polls seem to be continuing the same mistakes and under-counting and mis-counting Latino voters, which he had originally picked up, and wrote about the day after the 2010 midterms. Around the same time some new polls started appearing in states like Nevada and Florida with bizarre data for Latino voters – Obama only had an 8 point lead among Nevada Latinos, and Romney was actually ahead among Latinos in Florida. Really?
No.
And now the worst offenders might be the newest batch of national polls are attempting to estimate the national Obama-Romney horse race numbers. Monday October 22, Monmouth University released a poll in which Romney leads Obama 48% to 45%. Among Latinos, they report Obama leads by just 6 points – 48% to 42%. These numbers are such extreme outliers that even Romney campaign surrogates would have a hard time believing them. While Monmouth is the most recent, there have been many national polls with equally faulty numbers among Latinos.
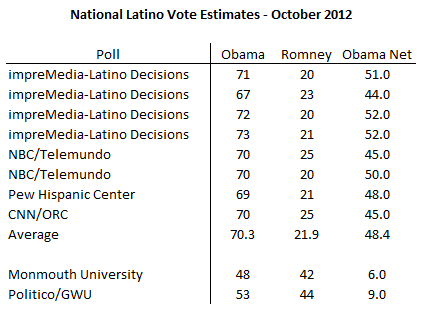
Keep that 48 to 42 number in your head and let’s compare across a variety of recent polls of Latino voters. As a matter of self-interest, we’ll start with four recent impreMedia-Latino Decisions tracking polls in October. The last four polls released by IM/LD have found the Latino vote nationally at 71-20; 67-23; 72-20; 73-21. Don’t like those? NBC/Telemundo have released two polls in October of Latinos, putting the race at 70-25, and 70-20 just before that. And then there was the Pew Hispanic Center poll 10 days ago which had Obama 69-21 over Romney, and just before that CNN did a poll of Latinos putting the national vote at 70-25. Okay – that’s eight national polls of Latino voters in the month of October and the average across all eight is 70.3% for Obama to 21.9% for Romney.

The Monmouth poll is not the only one that is off, the Gallup tracking poll has also been heavily criticized for mis-calculating the minority vote. Noted Political Scientist Alan Abramowitz has written recently that Gallup has too many Whites and too few Blacks and Latinos in their sample, not keeping up with simple demographic changes in America. And other polls are similarly off. A Politico/GWU poll in mid-October had Latinos 53-44 for Obama, +9 nationally.
Let’s examine how these faulty Latino numbers create problems with the overall national estimates. Afterall, Latinos are estimated to comprise 10% off all voters this year. If Latinos are only leaning to Obama 48-42, that +6 edge among 10% of the electorate only contributes a net 0.6 advantage to Obama (4.8 for Obama to 4.2 for Romney). However, if instead Obama is leading 70.3 to 21.9 that +48.4 edge contributes a net 4.8 advantage to Obama (7.0 to 2.2), hence the national polls may be missing as much as 4 full points in Obama’s national numbers.
Let’s break the numbers down a bit more to see if the math adds up, as Bill Clinton is so fond of saying…
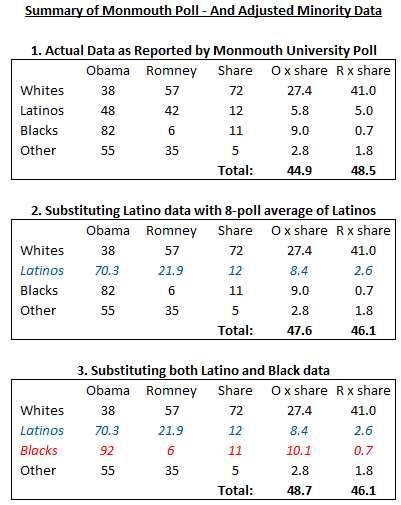
Looking at the Monmouth Poll, overall they give Romney a +3 edge nationally, 48 to 45. According to their crosstabs by race and ethnicity (posted here), the first tab below shows the data as collected and reported by the Monmouth Poll, including their estimates of the share each racial group will comprise of the electorate. If you take the vote percentages for each candidate times the share of the electorate that Monmouth gives each group, you can arrive at the contribution that each racial group makes towards the overall support numbers for each candidate.
Assuming the data as reported by Monmouth, Latinos would add 5.8 points to Obama and 5.0 point to Romney, a net edge of 0.8 points towards Obama. However, in tab 2, we plug in the 8-poll average among Latinos as reported above, 70.3 to 21.9. Here, we see Latinos contribute 8.4 points to Obama and 2.6 to Romney, a net edge of 5.8 points towards Obama. With this adjustment, that 5 point swing in the overall national data towards Obama takes what was a +3 .6 advantage for Romney and turns it into a +1.5 advantage for Obama, 47.6 to 46.1. This is the exact story of the 2010 Nevada data in which poll after poll showed Angle ahead of Reid, and Latinos only slightly breaking to Reid. On Election Day Reid won by 5 points, an 8-point swing from the poll average, and he carried Latinos 90-to-10.

However, we might also look at the Monmouth (or any of the national polls) data among Blacks and expect they have underestimated the Black vote for Obama. Rather than carrying 82% of the African American vote, a more realistic prediction is that Obama will win 92% (or more) of the African American vote. A recent NBC/Wall Street Journal poll showed 94% of Blacks planning to vote for Obama and 0% for Romney. If we add 10 points to the Black vote for Obama – an adjustment I doubt anyone would disagree with – we find a full additional point in favor of Obama nationally, 48.7% to 46.1%.
Dozens of polls this year are making these exact same errors that Harry Pachon and Rudy de la Garza pointed out 14 years ago. And by the way, their report title carried the phrase “Again!” because they pointed out that polls in California in 1994 and 1996 had made similar mistakes in underestimating the Latino vote.
If these mistakes are being made nationally where Latinos comprise an estimated 10% of all voters, they are even worse in statewide polls in Nevada, Florida, Colorado and Arizona where Latinos comprise an even larger share of all voters. In Florida Latinos are estimated at 17% of all voters. If you are badly mis-calculating the candidate preference among 17% of the electorate (that’s 1 out of every 6 voters), then the entire statewide estimates are wrong. A PPP poll out yesterday in Florida had Romney leading 49 to 46 among Latinos in Florida, and overall Romney was ahead 48 to 47. The PPP poll likely had around 130 Hispanic respondents, all interviewed via robotic IVR method, which has notoriously low and problematic response rates among Latinos. A Latino Decisions October poll showed Florida Latinos backing Obama 61 to 31.
Understanding, and accurately polling the Latino electorate is important not just for the sake of getting a correct portrait of Latino voters, but because they are such a large part of the overall electorate that “missing the Latino vote” ultimately results in missing the true vote of the entire electorate, whether in a swing state, or nationally.

