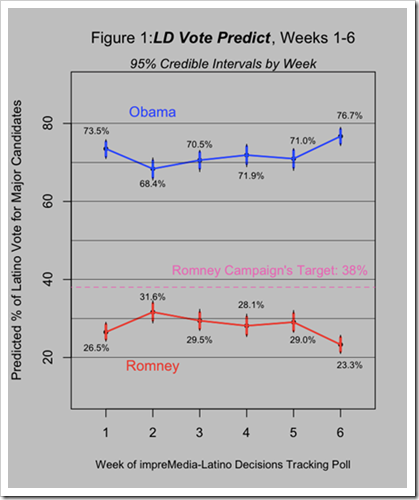
It seems that Presidential Candidate Mitt Romney’s hopes of reaching a respectable level of support among Latino voters may be dwindling. The Romney campaign’s own stated target of 38% of the Hispanic vote is shrinking from view according to our latest results. After the GOP convention Mitt Romney’s predicted share reached a peak of 31.6%. After the DNC his numbers declined only slightly, if at all (with a drop statistically indistinguishable from zero). For weeks three through five of the impreMedia-Latino Decisions tracking poll, our LD Vote Predict results showed Romney holding steady at between 28% and 30% of the Latino Vote, but it seems that Obama’s lead among Latinos is now growing. According to the new results reflected in the figure below, based on polling conducted between September 15th and 27th, Barack Obama is currently predicted to take a full 76.7% of votes cast by Latino candidates, with only 23.3% going to Mitt Romney. There is a high probability that between 74.8% and 78.5% of Hispanic voters who turn out to vote (including those currently undecided) will vote for Obama.[1]

Any apparent change in a single week of a tracking poll should generally be taken with a grain of salt, but a few factors lead us to believe that this is more than a short-term trend. First of all, the increase in Obama’s lead among Latinos is statistically distinguishable from zero; it is therefore highly unlikely that the jump is due simply to sampling error. Second, the movement we are seeing corresponds to similar trends among all voters (see Real Clear Politics). Finally, while it is always risky to speculate about what may be driving a change in polling numbers, some recent bad press for Romney may help explain the recent numbers.
The title of Jordan Fabian’s op-ed for ABC-Univision says it all: “Romney Secret Video Exposes Latino Problems.” The now infamous video of Romney speaking at a fundraiser, appearing dismissive of poor and many working-class people, may have helped solidify Obama’s support and alienated a handful of voters who might otherwise have considered voting for Romney. His joke, captured on the same recording, that he would have “a better shot at winning” the election if he were of Mexican heritage surely rubbed many Mexican-Americans and other Hispanics the wrong way, as did his dire warning of disaster for the nation should Latino voters increasingly support Democratic candidates. Taken together, Romney’s “Let Them Eat Cake” moment (complete with sounds of silverware clinking on china at the $50,000-a-plate event) and his specific references to Latinos, may have reinforced the perception that he is out of touch with the vast majority of Latino voters.
Any hope that the Romney campaign can undo some of the damage may be dwindling as well, as Obama’s and Romney’s favorability ratings diverge. In this week’s release of the impreMedia-Latino Decisions Tracking Poll, Obama’s favorability numbers are way up. Those who view him “very favorably” make up 55% of registered voters, better than any previous week of the tracking poll and a full 10 points higher than his average 45% favorability during weeks one through five. Meanwhile, only 10% have a “very favorable” view of Romney, tying his lowest mark thus far in our polling. By contrast, a full 45% have a “very unfavorable” view of Romney. These changes in favorability are showing up in declared candidate preference, with 67% of Latino registered voters indicating that they are certain to vote for Obama, while just 16% are certain to vote for Romney. These represent high and low marks, respectively, for the candidates in our tracking poll up to this point.
Charges of Skewed Polls Dominate Election 2012 Conversation
Last week political commentators devoted a great deal of attention to possible pitfalls of polling methods, or—better put—the assumptions built into various measurement choices in surveys. It is possible that the claims of wide-scale polling inaccuracy made by a number of Romney supporters (see, for instance, the story from Reuters on September 27), and discussed by many journalists and pundits (e.g., Eugene Robinson’s column for the Washington Post, and Douglas Schoen’s column for Fox News) may just reflect the frustration within a struggling campaign. And although their central claim that pollsters are systematically oversampling Democrats shows a misunderstanding of the design of these polls (see, for instance Steve Singiser in the Daily Kos), the general concerns raised in such forums are not completely illegitimate; indeed, similar concerns are what drive our efforts at Latino Decisions.
The most common gripe currently being voiced is that pollsters are basing their research designs on sampling strategies tending to result in an artificially large number of Democrats in the sample. More specific to Latinos, Christina Constantini writes for ABC-Univisión, that “While Latinos will certainly swing Democrat, no one knows how many will truly vote when the time comes, particularly in swing states.”
It is true that nobody knows exactly how many Latinos will vote, as such uncertainty is inherent in any poll used to infer future behavior. This is no reason however to throw our hands up and ignore the ample information we do have access to. Each polling firm has its own formula for figuring out who is a likely voter, and some such polls may indeed end up inadvertently biased toward one party. This error can go in either direction, however; just as many eventual non-voters may be included in a sample if they are characterized as “likely” voters, many eventual voters may be excluded from a sample for being deemed “unlikely” to vote. Whether the practice of restricting attention to likely voters yields biased estimates depends on (1) the percentage of unlikely voters who wind up voting, and (2) the difference in vote choice between the sets of likely and unlikely voters. In 2008, the fact that more than the expected number of non-traditional voters came out to vote, and that the percentage of these voters who cast ballots for Obama was higher than among more likely voters, meant that some pre-election polls underestimated the vote margin for Obama. The opposite could occur this time, depending on the definitions of “likely voter” being employed and the dynamics at play in this election, including new obstacles to voting by less frequent voters.
It is for this very reason that we have developed LD Vote Predict and LD Turnout Predict to aid our analysis of the current impreMedia-Latino Decisions Tracking Poll. Using data from past elections, we estimate the probability that each respondent will turn out to vote in light of his or her answers to survey questions, as well as the probability of voting for a particular candidate. In this way, we address two sources of skepticism in public responses to election polls, (1) the arbitrary distinction between “likely” and “unlikely” voters, with only the former being asked to offer opinions, and (2) the typically unaddressed question of how undecided voters are likely to vote.
We may not be able to correctly guess which individuals will actually vote, or for whom, but we do have relevant information to allow us to be right on average, and to get an accurate read on turnout or proportion voting for each of the top candidates. In the impreMedia-Latino Decisions Tracking Poll, for instance, we ask respondents to assess their likelihood of voting in the upcoming election. While this information by itself does not give us the ability to predict whether an individual will vote, considered in conjunction with other information, such as validated records of respondents’ voting history, this question actually provide reasonably accurate measures of aggregate turnout levels. Thus, for LD Turnout Predict, we model the relationship between a number of key variables and the propensity to vote, a relationship learned by analyzing data collected in previous elections. Our turnout predictions may then be based not simply on the percentage of respondents claiming they are nearly certain to vote, but on the estimated probability of voting for each respondent aggregated over the sample, and extrapolated to the population of Latino registered voters at large.
LD Turnout Predict and the Possible Impact of Vote Suppression
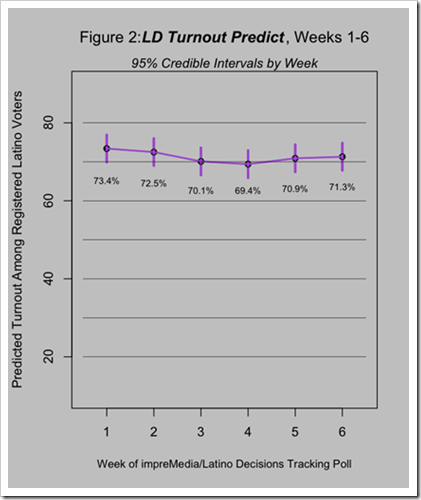
Predicted turnout over several weeks (Figure 2 below) has remained steady, with just a slight drop in anticipated turnout since the first week of polling.[2] In our 2010 tracking poll, we found a similar dip in the first few weeks, with a strong surge in predicted turnout as Election Day approached.

Of course, our model makes the assumption that there will be no radical shift in the relationship between a person’s stated intention to vote and past voting history on one hand, and the probability that he or she actually winds up voting on the other hand. Thus, if something should happen to make it more likely for voters intending to vote to be unable to do so, the actual turnout could be lower than we are currently predicting.
A recently released study by the Advancement Project has predicted that up to 10 million Hispanic voters might be affected by voter ID laws (see commentary from The Daily Beast). This does not mean that anywhere near this many will switch from voters to non-voters, as only 8-12 million eligible Hispanic voters are predicted to vote in the upcoming election. However, if various state efforts to restrict voting have the effect of reducing the number of Latinos who vote this year by a more modest 500,000, this could have a dramatic impact on projections. More specifically, our turnout predictions would drop from 70% turnout to around 65% of registered voters. In close races, such as those in North Carolina and Nevada, even a small decline in the probability of voting, given the intention to vote, could be enough to tip the outcome.
Justin H. Gross is the Chief Statistician for Latino Decisions and an Assistant Professor of Political Science at the University of North Carolina.
[1] Note that our original estimate from the first wave of polling has been revised; we had estimated 77.4% turnout, based on the early data. We have since made a slight adjustment in our modeling strategy, updating this earlier prediction.
[2] Technically, the 95% Bayesian credible intervals are (74.8, 78.5) percent for Obama and (21.5,25.2) percent for Romney.


