This is the first of two posts introducing new models that Latino Decisions will use in predicting Latino voter turnout along with the choice of candidate by those voters who do turn out to vote. We begin with our plan for estimating Latino voter turnout based on the results of our weekly Latino Decisions/impreMedia tracking poll, taken together with respondents’ past voting history. Estimation of Presidential vote choice among Latino voters shall be described in a subsequent post.
LD Turnout Predict is a proprietary model that allows us to identify likely voters with considerably greater accuracy than standard screening techniques. Moreover, the model goes beyond simple classification of registered voters as likely or unlikely, instead assigning an estimated probability of voting to each respondent in a manner designed to allow us to effectively ascertain aggregate voter turnout
Typically, pre-election polling relies on a distinction between “likely” and “unlikely” voters. Discrepancies between polls of registered voters and those restricted to likely voters are not uncommon, and frequently cited by pundits during each election season. Each polling firm has its own method of ascertaining who shall be deemed likely or unlikely to vote (see, for instance, AAPOR). Predictions are then based exclusively on responses from those labeled as likely. Since a number of likely voters will not wind up voting, and some unlikely voters will in fact cast votes, this common practice has the potential to throw off our estimates, presuming what we are in fact interested in are actual voters. The greater the turnout of relatively unlikely voters and the greater the difference in candidate preference among voters of each type, the larger the resulting error in estimation. In July 2008, for example, Gallup reported that Obama was leading McCain by three points among registered voters, but trailing by four among likely voters. In retrospect, the fact that a larger than typical number of infrequent voters (e.g., young people, Blacks, Latinos, and individuals with at most a high school education) turned out at the polls in 2008, and voted in disproportionate numbers for candidate Barack Obama, suggests that relying exclusively upon responses by likely voters would have led to an overestimation of support for McCain. Even in a more typical election, ignoring the preferences of the 40–50% least likely voters may lead to trouble. In order to account for possible differences in voting patterns among those with varying propensities to actually vote, we begin by estimating turnout.
Predictions of voter turnout are far less common than predictions of vote choice in journalistic election coverage. This is understandable, as turnout itself is not of particular interest to most members of the public. However, there are two reasons why consideration of Latino turnout merits our attention. The first is that if we can estimate an individual’s probability of voting, we can better estimate their probability of voting for a particular candidate (i.e., one’s probability of voting for Obama is equivalent to the probability of casting a ballot at all, multiplied by the probability of voting for Obama, given that one has actually voted.) The second reason to pay attention to turnout is that it may wind up being crucially important this year. Turnout among Hispanics has lagged behind that of their African-American and Caucasian counterparts. So, along with the hype accompanying each newly declared Year of the Latino Voter come the inevitable words of caution about the potential for disappointing turnout, a still slumbering “Sleeping Giant”, or the observation that Hispanic influence is a double-edged sword, with poor turnout having the potential to sink a Democrat’s candidacy as surely as a solid presence at the polls can make the difference in victory. Barring a dramatic improvement in Mitt Romney’s favorability among Latinos, those who do turn out are expected to vote for Obama by wide margins. Romney’s embrace of “self-deportation,” his promise to veto the DREAM Act, and seeming praise for Arizona’s SB1070 (the “Show Me Your Papers Law”) all but guarantee that turnout will be what determines whether Hispanic voters play a major role in the outcome of the presidential election.
At the heart of our technique to estimate turnout is the survey respondent’s own self-assessment. We ask whether our respondents are “almost certain” to vote, will “probably” vote, are “50/50” or “won’t vote.” Despite the fact that such responses are necessarily subjective and that individuals can be notoriously poor judges of such matters, it turns out that in the aggregate, the question provides a rather good measure of relative likelihood of voting. We use this information, in combination with records of past voting history in order to assign an estimated probability of voting to each survey respondent.* In order to get a sense of how we will use this model in the weeks ahead, let’s take a quick look at what we might have predicted at each wave of the 2010 tracking poll, had we possessed the necessary information.
Looking Back at Turnout in the 2010 Midterm Elections
How well might we have predicted turnout via LD Turnout Predict? While we now have the benefit of validated voting records to see whether each participant wound up voting or not, we do not use this information for the respondents whose probability of voting we are estimating each week. That is, for each wave of the 2010 tracking poll, we fit a model using only observations from other waves, so that our predictions are all made “outside of sample.” gives us a more realistic sense of how the resulting models will do in actually predicting turnout in a new election.
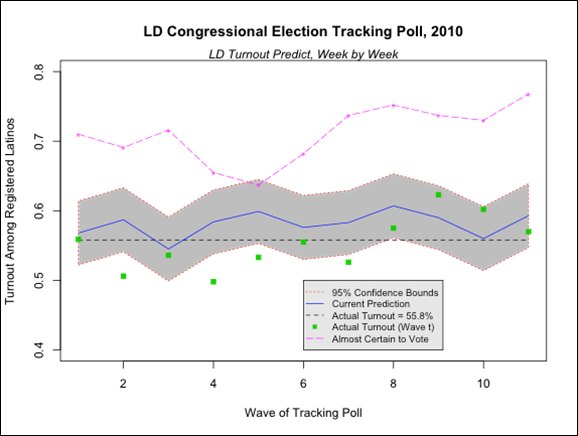
In the figure above, the pink dashed line on top, passes through the weekly estimates for the current proportion of registered Latinos who feel, at the time of being surveyed, “almost certain” that they will vote in the upcoming election. There is a fair amount of variability in this estimated proportion across waves of the poll. Although there is no real justification for doing so, it is not uncommon to find commentators treating this figure as a kind of proxy for turnout proportion. This makes sense only from a rigid perspective that treats “almost certain” as definitely voting and everyone else as not voting. In the 2010 tracking poll, this would lead to an overestimate of anywhere from ten to twenty percentage points.
Less variable than the weekly proportion of registered Latino voters claiming to be “almost certain” to vote is the proportion who actually wind up voting. The variability here must essentially be due to sampling error (three hundred cases at a time) and volatility in weight calibration (to correct for nonresponse). We include these plotted points (green squares) in order to have a benchmark against which to compare the weekly prediction, represented by the blue line and gray confidence interval. While it may be merely a coincidence that the confidence set includes more of the actual turnout values in later weeks (five of the last six, versus two of the first five), it may instead reflect the improved accuracy with which survey respondents assess their likelihood of voting, as Election Day approaches. Since the model generating the estimates connected via solid blue line uses information provided by the current wave’s respondents to generate the weekly predictions, it follows that the more accurate peoples’ self-assessments are, the less error-prone our resulting predictions will be.
Finally, the black dashed horizontal line indicates the actual voter turnout based on validated voting records (assuming our weighting procedures have adjusted adequately for the impact of nonresponse). Our best guess each week tends to overestimate the eventual turnout slightly, but model parameters estimated using observations drawn from other waves, we see a fairly stable pattern; estimates lie mostly between .55 and .65 and the eventual turnout rate of 55.8% falls within the 95% confidence interval around each week’s best guess.
Predicting Turnout in 2012
Wave One Turnout Prediction: 77.4% (+/– 6.2%)
As part of our analysis of the weekly LD/impreMedia tracking poll, being conducted from now until just before Election Day, we will provide weekly estimates of turnout using the LD Turnout Predict model. Our best estimate, based on data gathered in the first wave, is that 77.4% of registered Latino voters will vote in this year’s election.
That the predicted turnout for 2012 is on track to be well higher than it was in 2010 should not come as a surprise, given that this is a presidential rather than simply a midterm election. In applying the model, our key assumption is that, while turnout will vary from year to year, and individuals’ propensities to vote fluctuate from election to election, the underlying relationship between peoples’ voting histories and self-assessed likelihood of voting remains somewhat constant. Whatever voters’ past voting habits and own self-assessments can tell us about whether they will in fact vote in an upcoming election, we treat this relationship as stable across elections. Under some circumstances, this crucial assumption may lead us astray; consider, for example, the recent flurry of legislative activity, strengthening voter identification requirements in states such as Texas, Florida, and Pennsylvania (see, e.g., National Journal 7/16/12, and NPR 8/15/12 ). If these changes have the impact some are predicting, we may well observe a drop in Latino turnout undetected by LD Turnout Predict.
Going forward, we will regularly update these model-based predictions as new data are acquired. In addition to the estimates of turnout, we will project relative proportions of the vote going to each candidate, using a model to be discussed in a follow-up post.
Justin H. Gross is the Chief Statistician for Latino Decisions and an Assistant Professor of Political Science at the University of North Carolina.
* Technically, this is done via logistic regression, with regression parameters estimated using actual vote records from a previous election. The overall turnout is then estimated by taking an average of these individual estimated probabilities of voting, weighted in such a manner as to adjust for potential non-response bias and under-coverage by our sampling frame. Approximate confidence intervals are calculated using simulation-based variance estimates.


