New analysis of state voter registration counts by Latino Decisions reveals strong growth in Latino registered voters across the 50 states. In July, Ruy Teixeira and William Frey first analyzed the May 2012 Census data, and found that steady increases in the Latino citizen voting age population (CVAP) could decide five key battleground states in 2012. Taking the Teixeira and Frey data for the total eligible population, Latino Decisions has estimated the total registered voter population for Latinos and non-Latinos in each state, and compared the numbers from 2012 to 2008. By our count there are now nine states with 101 electoral college votes where the Latino vote could prove to be the deciding factor.
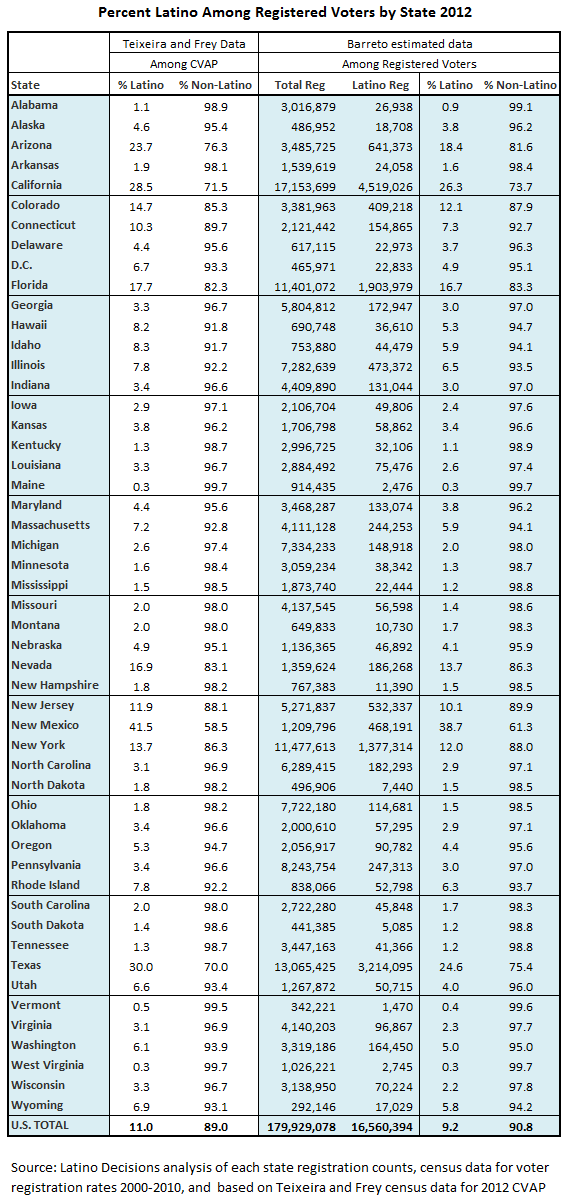
As a starting point, we took the latest data available from all 50 states official voter registration statistics as reported on each state’s website. For most states the latest data was from June or July 2012 for the total number of registered voters (both active and inactive) listed on the state voter rolls. For some states the most recent counts were from December 2011. Next, we examined census data on voter registration rates among eligible voters, by race and ethnicity, from 2000 to 2010, and also considered 2012 voter registration data by race and ethnicity in key states where it was available. Thus, building on analysis of May 2012 CVAP data by Ruy Teixeira and William Frey we can now accurately estimate the percentage of registered voters who are Latino across the 50 states.
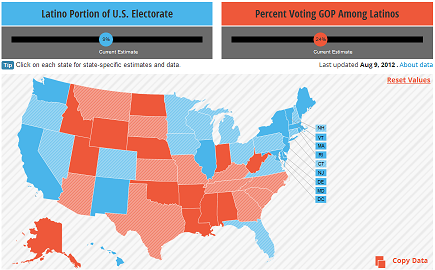
The full data are detailed below, however we start by measuring the political implications of the Latino vote on the electoral college in2 012. This week we have updated the estimated Latino vote share in the Latino Decisions/America’s Voice Education Fund Latino Vote Map tool to reflect these new estimates of Latino registered voters in all 50 states. This interactive electoral college map shows the size of the Latino vote, and the latest polling data for Latinos and non-Latinos in every state, and allows users to manipulate the map by changing the Latino turnout level, or presidential vote choice in each state.
Click image to go to www.latinovotemap.org
Tier 1 Latino States: Most notably, even small fluctuations in the Latino vote have a profound impact on the presidential election results in Colorado, Nevada and Florida. In each of these states, if Latino voter turnout decreases, Barack Obama loses his lead to Mitt Romney. Or, if turnout stays at expected levels but Romney gains 10-15 points among Latino voters he wins all three of these key battlegrounds and their combined 44 electoral college votes. There is absolutely no questions Latinos will be influential in these three states.
Tier 2 Latino States: Latino voters in Virginia, North Carolina and Iowa also demonstrate considerable influence in the 2012 presidential election. While the Latino electorate is smaller in each of these states, it has grown considerably in the last 4 years and if registration drives continue in these three states Latino voters may well decide the outcome if the overall margin is razor thin as anticipated. In Iowa Obama currently leads by 1 percentage point and Latinos are 2.4% of the electorate; in North Carolina Romney leads by 1 percentage point and Latinos are 2.9% of the electorate; and in Virginia Obama has a 3 point lead and Latinos are 2.3% of the electorate. Obama will need Latino turnout to be as high as possible to carry these three battleground states and their combined 34 electoral college votes.
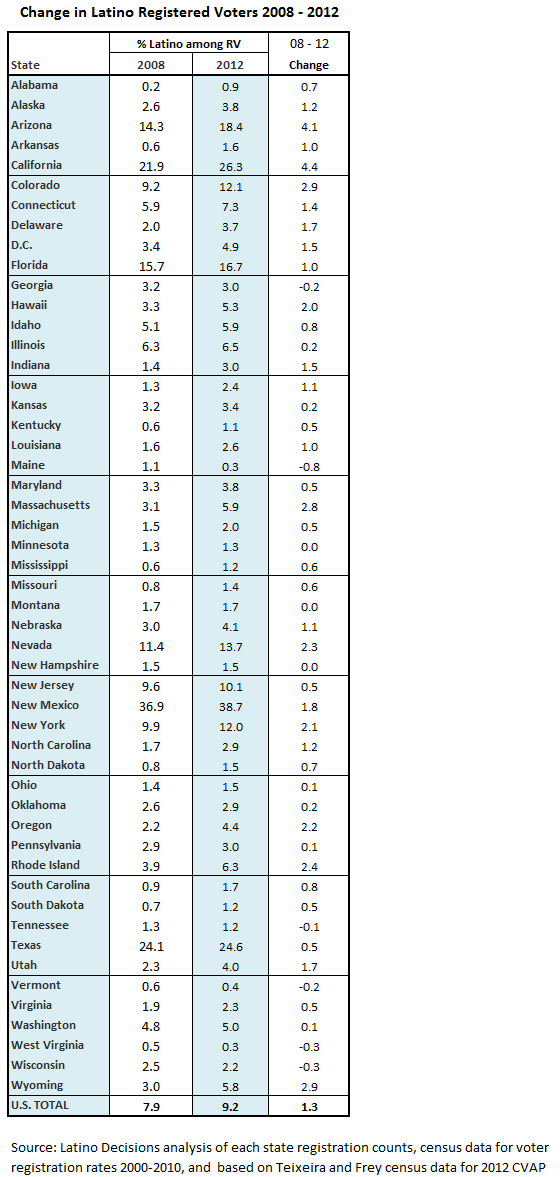
Tier 3 Latino States: The final place where Latino voters may be influential in the presidential election includes Arizona, New Mexico and Connecticut. While none of these states are currently toss-ups, they all have large Latino populations and slight changes could push them squarely into the battleground range. In Arizona, the Latino electorate is now estimated at 18.4% up from 14.1% in 2008, and the Arizona Latino electorate is currently trending the strongest towards Obama of any state. If voter registration continues to grow in Arizona and turnout is high (perhaps behind a Carmona surge), Latino voters could headline a major upset for the Democrats where Romney currently leads by 8 points. New Mexico has historically seen very close presidential elections, and at 38.7% of all voters, Latinos have a direct hand in almost all election outcomes. Currently Obama is leading New Mexico by 11 points, but if that lead narrows expect a full court press for the Latino vote. In Connecticut Obama leads by 8 points and Latinos are 7.3% of the electorate and in 2010, the governor’s race was decided be less than 1 percent. Combined these tier 3 states carry 23 electoral college votes in 2012.
In the tables below, we enumerate the Teixeira and Frey CVAP data alongside the estimated voter registration data for all 50 states, as well as comparing the new 2012 estimates against the 2008 voter registration estimates from the Census Current Population Survey.


Learn more about how the Latino Vote Map can help draw attention to your organization. For more information about how to integrate Latino Vote Map in to your website, to become a Latino Vote Map co-sponsor, or to create a customized Latino Vote Map for your organization, contact us at info@latinodecisions.com or at 425-336-7000.


