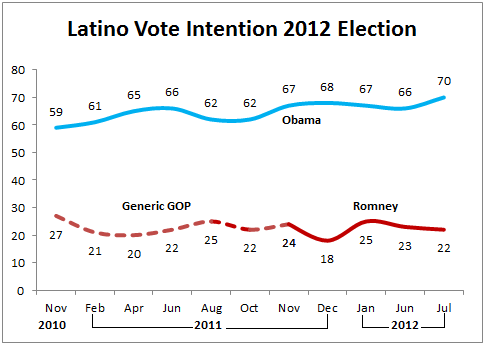
Latino Decisions released new national poll of Latino registered voters showing Barack Obama winning 70% of the Latino vote compared to 22% for Mitt Romney. The poll, commissioned by the Center for American Progress Action Fund and America’s Voice, illustrates an increase in support for President Obama, and comes after a month of outreach to Latino voters, starting with the June 15 Dream announcement, appearances by the President and Vice President at NALEO and NCLR conferences, and comments opposing Arizona’s SB1070 immigration law. This poll marks the first time Obama has received 70% of the vote in Latino Decisions polling on the presidential election over the past 20 months.

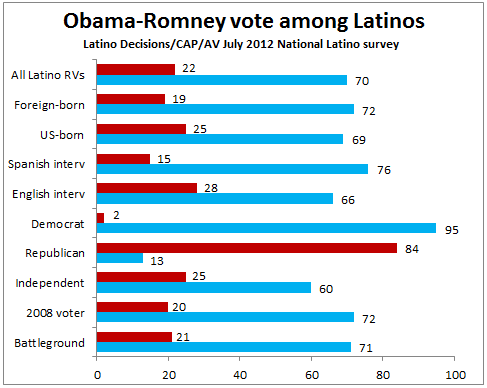
Obama maintains a substantial lead over Romney within nearly all segments of the Latino electorate. Among foreign-born, naturalized citizens Obama leads 72% to 19% and among U.S.-born Latinos he leads 69% to 25%. Similarly, Obama polls ahead of Romney by a large margin, 76% to 15% among Spanish dominant Latinos, and also has a healthy lead of 66% to 28% from English dominant. Two concerns for Romney may be that 13% of self-identified Latino Republicans say they will cross-over and vote for Obama and 60% of Independents plan to vote for Obama. In contrast only 2% of Democrats say they plan to vote for Romney.
Looking at voters with a validated vote history in 2008 Obama leads Romney 72% to 20%, and Latinos who reside in one of 13 critical battleground states (AZ, CO, FL, IA, IN, MI, MO, NC, NV, OH, PA, VA, WI) lean very heavily towards Obama, 71% to 21% for Romney. The lingering question now, is not whether Obama will win the Latino vote – he is poised to win it big, but rather whether Latino voter turnout matches or exceeds the record levels in 2008, or if Latino enthusiasm will be low and turnout mediocre at best. Even with a big margin among Latinos, if turnout is low Obama could fare poorly in many battleground states where Latinos are a large portion of the electorate (for more, see different turnout simulations and scenarios at LatinoVoteMap).

This release is part of a larger poll by the Center for American Progress Action Fund and America’s Voice to assess Latino attitudes in the wake of the Supreme Court decision on Arizona’s SB1070 immigration law, with additional results being released Thursday July 19th at an event at CAP, including Latino attitudes towards the Supreme Court decision.
An important note on Latino polls
As the election draws near, more and more poll results will be reported for Latino voters. We caution readers against relying on small Latino samples taken from a larger national poll. Instead, more reliable results will be found in polls that focus exclusively on Latino voters and maintain a larger sample size. For example, Latino samples taken from larger national polls are often small, between 80 – 200 and carry a margin of error between 8 – 11%. Further, because the overall target is all voters, the interviewers are not bilingual, and often try to call-back Spanish-dominant respondents who they could not communicate with in English. This results in greatly underestimating the number of immigrant and Spanish-speaking voters in polls. A recent poll from Quinnipiac reported a sample of just 143 Latinos, and 14% of interviews conducted in Spanish, an unacceptably low number. Finally, national polls are not designed to get an accurate geographic representation of Latinos because they draw a nationally proportionate sample of all Americans, and pick up Latino respondents wherever they surface. The Latino population maintains substantially different patterns of residence than the national population and as such, the Latino sample is rarely representative of the overall Latino population. For example, New Mexico has the 8th largest Latino population, but nationally it ranks 36th in size. Likewise Ohio has the 7th largest population nationally, but ranks 20th among Latino states.
Latino Decisions interviewed 504 Latino registered voters between July 7-16, 2012 using live telephone callers, sampled across all 50 states, and the Latino population in our sample is proportionate to the actual Latino population across all states. A mix of landline and cell phone-only households were called, and up to 5 attempts were made per number. Latino respondents had the opportunity to complete the survey in either English or Spanish, using fully bilingual callers, and overall 39% of Latinos chose to complete the survey in Spanish. Overall, the sample has a margin of error of +/- 4.4%. Additional survey results will be reported over the next several days.


