Back in August of 2012, impreMedia and Latino Decisions released our first round of results as part of an eleven week tracking poll series. Today we are taking a look back at those results to see how Hillary Clinton and Donald Trump compare to their political counterparts at this time four years ago. Recent polling from America’s Voice provides a perfect opportunity to make comparable point-in-time comparisons.
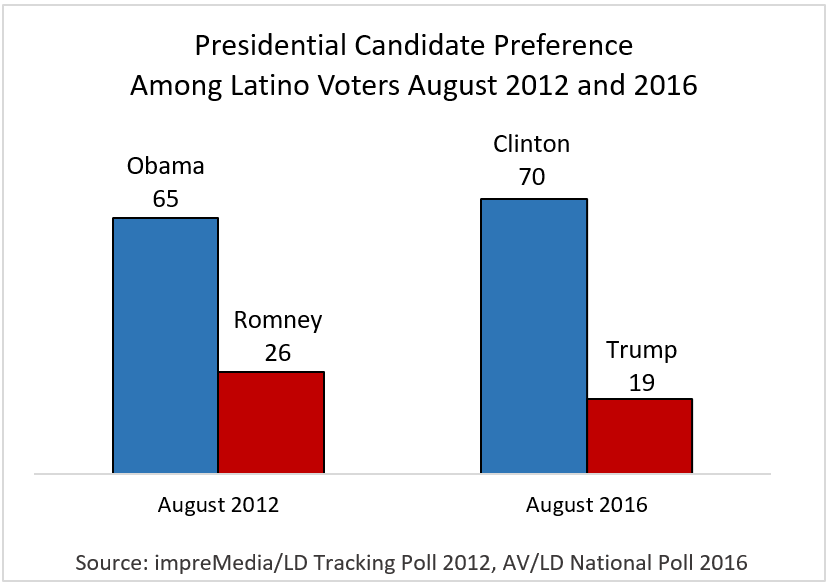
Hillary Clinton is five points ahead of where President Obama was at this point in his re-election campaign four years ago. In August 2012, 65 percent of Latino voters said they planned to vote for Obama, compared to 70 percent who said the same about Secretary Clinton just last month. As a point of reference, Obama’s vote share reached the 70 percent mark six weeks later, in the late September round of the tracking poll (see the full 2012 tracking series here).
Whether in context of her own election, or compared to 2012, Clinton has strong traction with this electorate that is extremely hard to match. Mitt Romney stood at 26 percent at this time four years ago, trailing the President by nearly 40 points. Donald Trump’s mere 19 percent support is seven points worse than Romney year-to-date. The huge 51-point gap between Trump and Clinton is even wider than the one we saw in 2012.
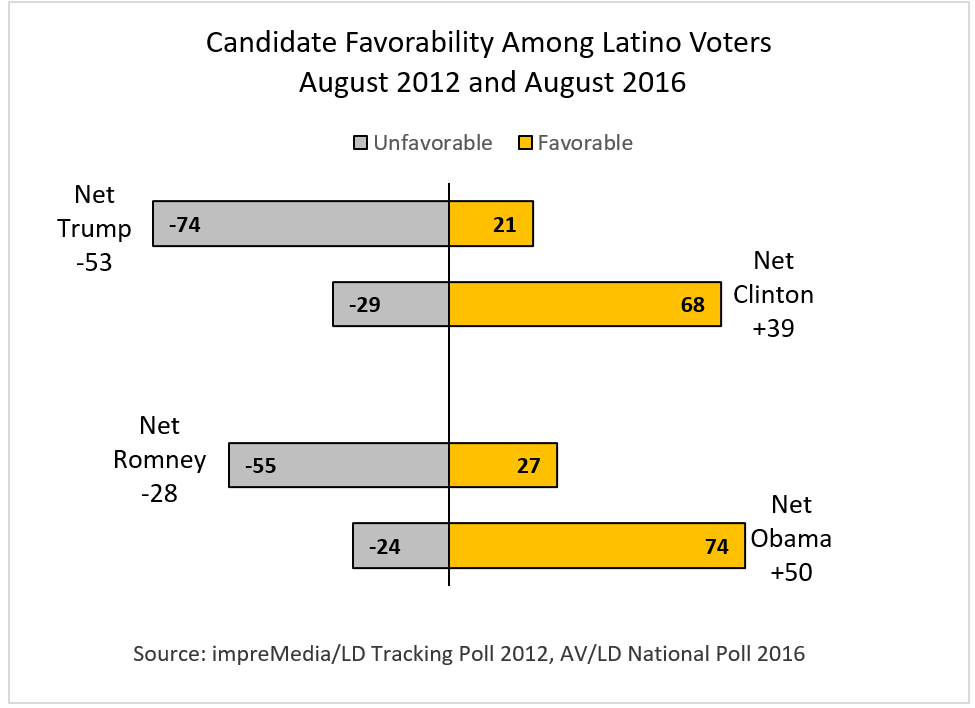
President Obama had a net favorable rating of +50 (74% favorable, 25% unfavorable), and Mitt Romney had a net negative of -28 on this measure (55% unfavorable, 27% favorable). The gap between the two candidates was huge, but has been eclipsed by the current contest where Trump has a net negative of 53 percent unfavorable, compared to Clinton’s net of 39 percent favorable.
It is important to point out that Latino voters do not see 2016 as a contest between two equally disliked candidates. Clinton is very popular with Latinos, 68 percent have a favorable view of her. Latinos are even more cohesive in their dislike for Trump: three out of four have an unfavorable view of the Republican nominee.
Clinton’s favorable share is six points behind Obama’s year-to-date. It is worth remembering that President Obama enjoyed the benefits of running as an unopposed incumbent, and Latino voters were especially buoyed by the DACA announcement earlier that summer.
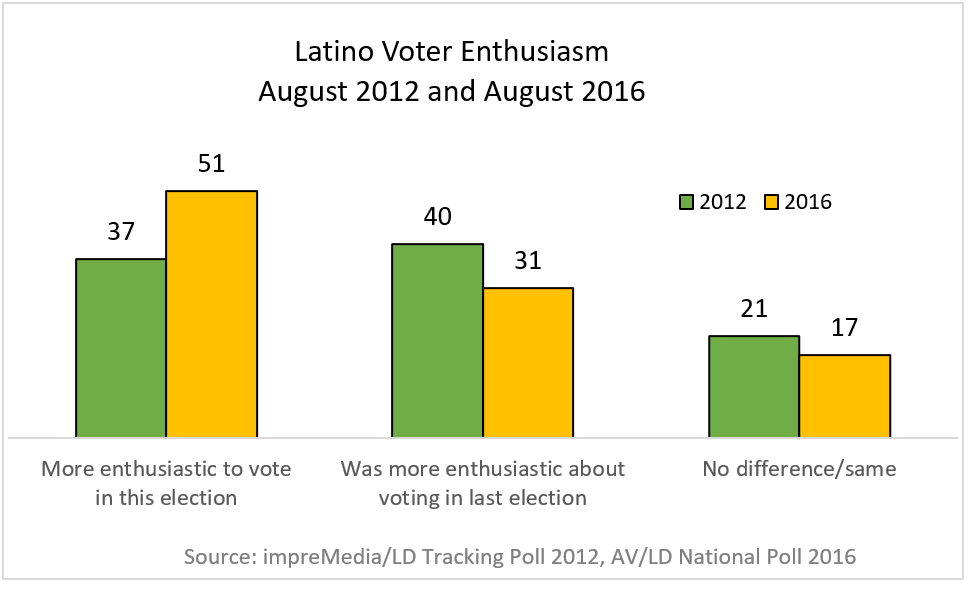
Enthusiasm is up among Latino registered voters. In August of 2012, only 37 percent said that they were more enthusiastic about voting in that race compared to the prior presidential election. Today, 51 percent tell us that they are more enthused about voting this time compared to 2012. In the 2012 tracking poll series, enthusiasm peaked at 47% the week before election day. Thus, Latino voter enthusiasm has already eclipsed the high-mark observed in 2012.
Narratives of Clinton’s under performance among Latino voters have circulated at various points during this election cycle. We find no empirical basis for such claims. Our data, from comparable polls taken at identical points in the general election cycle, suggest that Secretary Clinton is poised to do as well, or perhaps better, than President Obama did in 2012 with the Latino electorate.