With both parties’ presidential nomination campaigns settled, the 2016 general election match-up between Democrat Hillary Clinton and Republican Donald Trump is coming into focus. Central to these discussions is the support that the candidates are likely to draw from Latino voters. Yet, as has been the case in recent election cycles, the difficulties associated with sampling a representative cross-section of Latino voters has led to polling indicating that nearly a third of Latinos are poised to vote for Trump; a rate of support for Trump that is two to three times greater than suggested by other polling, including our own.
Adding to this ambiguity is pollsters typically provide little information about the preferences of various subgroups of Latino voters making it impossible to know if these polls contain a representative sample of Latino voters. Indeed, as our colleague Stephen Nuño has recently written, there are a number of factors that can undermine the ability of pollsters to draw a representative sample of Latino voters.
In contrast, Latino Decisions’ polling focuses exclusively on the preferences of Latino voters and when we publicly release poll results, we typically include detailed cross-tabs summarizing subgroup differences within the Latino electorate. Still, even as informative as our cross-tabs are, they only consider the relationship between two or three variables at the most.
Or put differently, because variables such as age, gender, language preference, education, and partisanship are correlated with each other, the impact of each of these factors suggested by a cross-tab is likely to be overstated because the cross-tab is capturing the influence of the variable of interest, as well as the part of the variable that is shared with other relevant variables.
Fortunately, there are statistical techniques that allow the effect of multiple variables to be simultaneously parsed to estimate the net effect of each factor. The big catch is these methods require large samples; something that does not exist in a poll that may include fewer than 100 Latino respondents. Thus, to assess variation in Latino political behavior, I use national data from the first wave of the “America’s Voice/Latino Decisions 2016 Tracking Poll” that was conducted in April. The poll contains a national sample of 2,200 Latino registered voters, but because respondents who either did not answer specific questions or who responded “don’t know” are excluded, the sample used in the analyses reported below varies between 1,639 and 1,814 observations.
Specifically, I use these data to estimate a series of logit models assessing variation in registered Latino voters’ likelihood of identifying as a Democrat or Republican, holding a favorable view of Hillary Clinton or Donald Trump, and voting for Donald Trump instead of Hillary Clinton. In social science research jargon, these variables, all coded as either 1 or 0, represent the dependent variables of interest. The independent variables included in the models to account for the variation in the dependent variables highlight the socio-economic (education and income), demographic (gender and age), and cultural (Spanish speaking and Cuban descent) factors that prior research suggests account for variation in Latino political behavior.
The inclusion of these variables have the added benefit of capturing the effects of factors that, in our experiences, are commonly underrepresented in samples of Latino voters: failing to account for language variation and small numbers of less educated, less affluent, and younger Latinos.
Due to the complexity of interpreting the results of logit analyses, rather than present the coefficients, their standard errors, and the model statistics, the table below summarizes the changes in the predicted probabilities for the statistically significant coefficients (p < .05, one tailed)[i] when the variable of interest is increased from its minimum to maximum value and the effects of all other variables are held constant.
Thus, the table presents, the net effect of each independent variable, while controlling for the influence of the other variables in the model. Also note that many of the variables are statistically insignificant and therefore, their cells are blank. This largely stems from the fact that there is little variation to explain. For example, among respondents expressing a preference, 13% indicated that they would support Trump in an election against Clinton and fewer than 10% view Trump either very favorably or favorably. As a consequence, for a variable to exert a statistically significant effect necessitates a sharp deviation from the Latino electorate as a whole.
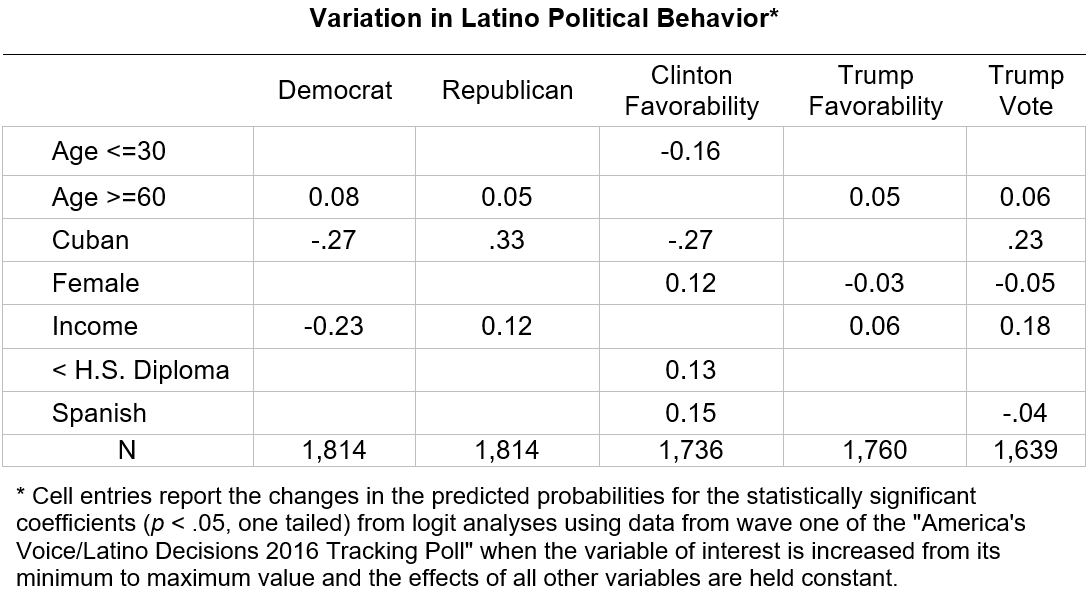
Looking first at the columns estimating the factors driving Democratic and Republican identification suggest near opposite effects. Whereas the probability that a Latino who is Cuban will identify as a Republican increases by .33 as compared to a non-Cuban, the probability that a Cuban as compared to a non-Cuban will identify as a Democrat decreases by .27. The effects for income are similar: the probability that a Latino earning more than $150,000 will identify as Republican, as compared to a Latino earning less than $20,000, increases by .12, while the probability of identifying as a Democrat decreases by .23. The results also suggest that older Latinos are more likely to identify as Democrats or Republicans as compared to the referent category (voters between the ages of 31 and 59).
In terms of the candidates’ favorability, Clinton draws the most support from Latinas (+.12 as compared to Latinos), those who did not graduate from high school (+.13 as compared to those with more than a high school degree), and Spanish speakers (+.15 as compared to English speakers), while Cubans (-.27 as compared to non-Cubans) and those 30 years old or younger (-.16 as compared to those between the age of 31 and 59) have lower probabilities of viewing the former Secretary of State favorably.
The latter data point is suggestive of the generational split that largely defined the Democratic nomination campaign. Indeed, while over 70% of Latinos over age 30 held a favorable view of Clinton, the same held for just 52% of Latinos 30 years or younger. In contrast, over 85% of Latinos 30 or younger viewed Sanders favorably as compared to 65% for those older than 30. For comparison, 9% of Latinos 30 and under hold a favorable view of Trump; slightly less than the rate for those 31 and older. As the data in column four suggest, Trump’s favorability is strongest among those with higher incomes and who are age 60 and older. Trump also does somewhat better with males as compared to females (-.03).
The final column presents the changes in the predicted probabilities of voting for Trump over Clinton. Consistent with Republican identification, Latinos who are Cuban (+.23), older (+.06 as compared to those between the ages of 31 and 59), and with incomes greater than $150,000 (+.18 as compared to those earning $20,000 or less) have increased probabilities of voting for Trump, while Latinas and Spanish speakers have decreased probabilities of voting for Trump (-.05 and -.04 respectively).
The analysis presented here has a number of important implications for understanding Latino political behavior. Most significantly, Latinos are not monolithic in their preferences as the results suggest variation in Latino political behavior stemming from age, nationality, gender, income, and language use.
More to the point, while there are subgroups of Latinos who remain open to the Republican Party and its candidates, this support is limited to small swaths of the Latino electorate. For instance, less than 5% of the sample reported earning incomes of $150,000 or more, and Latinos over the age of 60 constitute just 29% of registered Latino voters; a slightly smaller share than those who are 30 and younger. Moreover, outside of south Florida, there are insufficient concentrations of Cuban-Americans to offset the Democratic leanings of other Latinos.
The analysis also clearly indicates the consequence of drawing conclusions about Latino voters from polls that do not include a representative sample of Latino voters. Most obviously, the components of the Latino electorate that are least likely to be captured by the methods employed by many polling firms (e.g., younger, Spanish-speaking, lower socio-economic Latinos) are some of the strongest Democratic supporters and the least receptive to the GOP and its presidential nominee. In contrast, Latinos who are most likely to be sampled (those who are older and with higher incomes) have preferences that are clearly distinct from the Latino electorate in general.
In sum, polling that includes too few Spanish speakers, too many high-income, college educated Latinos, and too many older Latinos are likely to suggest stronger support for Trump and weaker support for Clinton. That fact that respondents with these characteristics are more likely to be sampled and have higher response rates is not all that surprising, but failing to include a sufficient number of lower socio-economic-status, young, Spanish-speaking Latinos will yield a biased sample that misrepresents the preferences of the Latino electorate.
[i] Statistical significance captures the likelihood of making a type one error by inferring that a result found in an analysis of a sample does not hold in the population. A finding that is significant at .05 level, a commonly used threshold in the social sciences, means that there is a one in twenty chance of making a type one error.
David Damore is a Senior Analyst at Latino Decisions. He is Associate Professor of Political Science at the University of Nevada, Las Vegas, and a Senior Nonresident Fellow in the Brookings Institution’s Governance Studies Program.